Solar calculator
How many solar panels do you need, and what will they save?
Partner link: we may earn a commission if you request quotes. It never changes our numbers.
Built on the PVWatts solar model with ten years of NASA weather for your state, and your state's average electricity price (EIA). Data updated · How we calculate this
Your state, your bill
Solar in California
Up to $167 a month
off your bill ($2,004 a year). Pays for itself in about 4 years, then it's savings for the rest of its 25+ year life.
About 9 panels (3.4 kW) for about $8,718 before incentives at the US average of $2.60 a watt.
Panel size and output details
Makes about 6,027 kWh a year, at 1,798 kWh per kW of panels in California (PVWatts).
A $167 bill at 33.3¢ is treated as 502 kWh; fixed monthly fees make the real figure somewhat lower. Output assumes south-facing panels at a 20° tilt with no shading (PVWatts). Savings and payback assume your utility credits all the power the panels make at the full retail price, with no rebates; they ignore financing, maintenance and rate changes. Where exports earn less, savings are lower.
The formula
System size (kW) = yearly use (kWh) ÷ yearly output per kW. Then panels = system size × 1,000 ÷ panel watts.
Output per kW comes from PVWatts, the solar model published by the National Laboratory of the Rockies (formerly NREL), run on 2015–2024 hourly NASA weather data for a large city in each state, a south-facing roof at a 20° tilt and its default 14% system losses. Worked example for Arizona: 12,000 kWh ÷ 1,794 kWh per kW = 6.69 kW, and 6.69 × 1,000 ÷ 400 = 17 panels.
The value figure multiplies the output by your state's average residential price, currently 15.4¢ in Arizona — $277 per kW per year. That is the most the panels could save if every kWh replaced one you would otherwise buy.
Solar output and system size by state
Sorted by output per kW. System size is what it takes to cover that state's average household use.
| State | kWh per kW/yr | Avg use kWh/mo | System size | Panels | Value per kW/yr |
|---|---|---|---|---|---|
| California | 1,798 | 503 | 3.4 kW | 9 | $598 |
| Arizona | 1,794 | 1,075 | 7.2 kW | 18 | $277 |
| Nevada | 1,771 | 930 | 6.3 kW | 16 | $240 |
| New Mexico | 1,769 | 654 | 4.4 kW | 12 | $267 |
| Hawaii | 1,745 | 495 | 3.4 kW | 9 | $807 |
| Colorado | 1,616 | 674 | 5.0 kW | 13 | $270 |
| Utah | 1,583 | 774 | 5.9 kW | 15 | $208 |
| Wyoming | 1,549 | 863 | 6.7 kW | 17 | $216 |
| Oklahoma | 1,523 | 1,079 | 8.5 kW | 22 | $207 |
| Kansas | 1,514 | 876 | 6.9 kW | 18 | $230 |
| South Carolina | 1,454 | 1,050 | 8.7 kW | 22 | $232 |
| Idaho | 1,447 | 944 | 7.8 kW | 20 | $188 |
| Florida | 1,441 | 1,104 | 9.2 kW | 23 | $220 |
| Louisiana | 1,405 | 1,202 | 10.3 kW | 26 | $188 |
| Mississippi | 1,399 | 1,156 | 9.9 kW | 25 | $213 |
| Virginia | 1,398 | 1,032 | 8.9 kW | 23 | $235 |
| North Carolina | 1,396 | 1,015 | 8.7 kW | 22 | $209 |
| Nebraska | 1,392 | 956 | 8.2 kW | 21 | $180 |
| Missouri | 1,392 | 1,001 | 8.6 kW | 22 | $194 |
| Montana | 1,389 | 852 | 7.4 kW | 19 | $194 |
| South Dakota | 1,389 | 994 | 8.6 kW | 22 | $201 |
| Texas | 1,373 | 1,096 | 9.6 kW | 24 | $220 |
| Alabama | 1,369 | 1,143 | 10.0 kW | 26 | $226 |
| Iowa | 1,364 | 832 | 7.3 kW | 19 | $194 |
| Arkansas | 1,363 | 1,048 | 9.2 kW | 24 | $186 |
| Georgia | 1,358 | 1,074 | 9.5 kW | 24 | $209 |
| North Dakota | 1,351 | 1,029 | 9.1 kW | 23 | $167 |
| District of Columbia | 1,337 | 639 | 5.7 kW | 15 | $330 |
| Delaware | 1,330 | 911 | 8.2 kW | 21 | $238 |
| Pennsylvania | 1,329 | 817 | 7.4 kW | 19 | $280 |
| Tennessee | 1,328 | 1,154 | 10.4 kW | 27 | $184 |
| Maryland | 1,323 | 929 | 8.4 kW | 22 | $282 |
| Rhode Island | 1,313 | 567 | 5.2 kW | 13 | $384 |
| New York | 1,302 | 571 | 5.3 kW | 14 | $382 |
| Minnesota | 1,300 | 712 | 6.6 kW | 17 | $211 |
| Maine | 1,294 | 550 | 5.1 kW | 13 | $388 |
| New Jersey | 1,280 | 662 | 6.2 kW | 16 | $307 |
| Illinois | 1,278 | 693 | 6.5 kW | 17 | $246 |
| Connecticut | 1,278 | 695 | 6.5 kW | 17 | $357 |
| Massachusetts | 1,270 | 570 | 5.4 kW | 14 | $383 |
| New Hampshire | 1,268 | 619 | 5.9 kW | 15 | $340 |
| Ohio | 1,261 | 846 | 8.0 kW | 21 | $236 |
| Indiana | 1,261 | 901 | 8.6 kW | 22 | $215 |
| Kentucky | 1,257 | 1,047 | 10.0 kW | 25 | $179 |
| West Virginia | 1,239 | 1,027 | 9.9 kW | 25 | $192 |
| Wisconsin | 1,232 | 645 | 6.3 kW | 16 | $234 |
| Oregon | 1,226 | 882 | 8.6 kW | 22 | $189 |
| Michigan | 1,205 | 618 | 6.2 kW | 16 | $259 |
| Vermont | 1,173 | 574 | 5.9 kW | 15 | $281 |
| Washington | 1,158 | 956 | 9.9 kW | 25 | $167 |
| Alaska | 873 | 578 | 8.0 kW | 20 | $236 |
Frequently asked questions
How many solar panels do I need?
Divide your yearly electricity use by how much 1 kW of panels produces where you live, then divide by the panel size. For example, a home using 1,000 kWh a month (12,000 kWh a year) in Arizona, where our PVWatts model estimates 1,794 kWh per kW a year, needs about 6.7 kW — 17 panels of 400 W. The same home in Washington, at 1,158 kWh per kW, needs about 10.4 kW or 26 panels.
How many solar panels does the average US home need?
The average US home used 863 kWh a month in 2024 (EIA). Covering that takes from about 5.8 kW (15 panels of 400 W) in California to about 11.9 kW (30 panels) in Alaska, because the same panel produces far more in sunny states.
How much electricity does one solar panel produce?
A 400 W panel is 0.4 kW, so it produces 0.4 times the state's kWh-per-kW figure. In California that is about 719 kWh a year; in Alaska about 349 kWh.
Is solar worth it without the federal tax credit?
It depends on three numbers: your installed price per watt, your electricity rate, and how your utility credits power you export. The 30% homeowner credit (25D) ended for expenditures after 31 December 2025, so compare a quote's price per watt with the break-even figures on your state's page. High-rate, sunny states pay back fastest.
Why does my installer quote a different size?
Installers model your actual roof: its direction, tilt, shading and space, plus your past 12 months of bills. This calculator assumes an unshaded south-facing roof at a 20 degree tilt, so treat it as a starting point and a way to sanity-check quotes.
Estimates only. Your actual costs depend on your utility's rate plan, how and when you charge or use power, and local prices. This is general information, not financial, tax or legal advice. See our disclaimer.
Sources
- PVWatts v8 solar model (National Laboratory of the Rockies, formerly NREL, run via its PySAM package) on NASA POWER hourly weather — 1 kW DC fixed roof mount, 20 degree tilt, facing south (180 degrees), standard module, 14% system losses, 96% inverter efficiency, DC/AC ratio 1.2 (PVWatts defaults except tilt). Checked against the PVWatts web API for eight states: within 8%, 3% on average.
- U.S. Energy Information Administration, 2024 Average Monthly Bill- Residential — 2024 (annual)
- U.S. Energy Information Administration, Electric Power Monthly, Tables 5.6.A and 5.6.B — July 2026 YTD (year to date); latest month July 2026
- IRS: FAQs on the modification of sections 25C, 25D, 25E, 30C, 30D, 45L, 45W and 179D under Public Law 119-21 — Fact sheet FS-2025-05, August 2025
Keep going
- Plug-in solar guideBalcony solar kits, state rules and real payback
- Find solar installersInstallers that list service in your state
- Home battery sizerPair panels with backup storage
- Energy data by statePrices, solar output and charging by state
- Solar incentives in 2026What changed and where to check state rebates
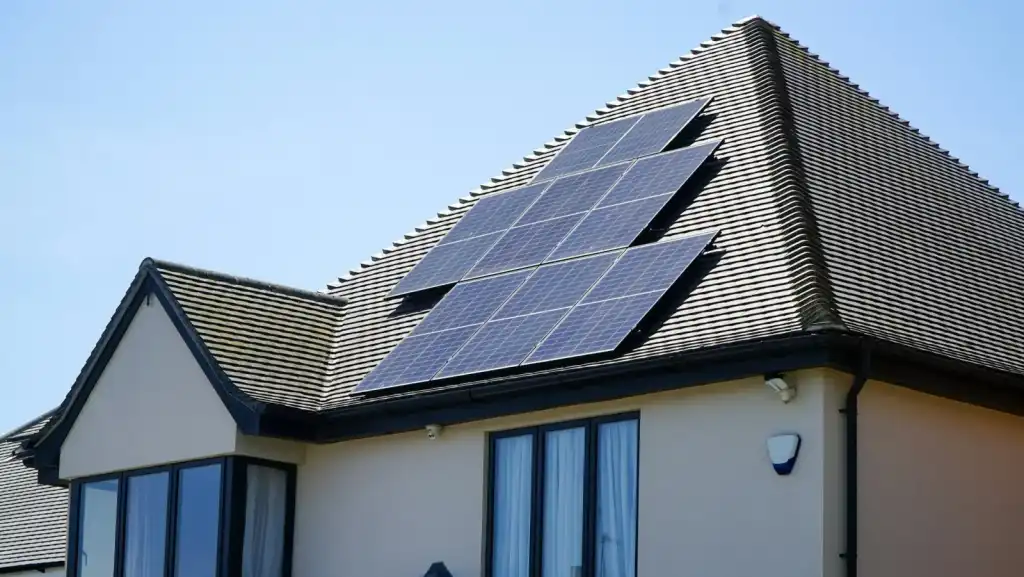
Photo: Watt A Lot on Unsplash (Unsplash License).